The first thing you notice on a Hastings site is the geophone spread—usually a 24- or 48-channel line with 4.5 Hz vertical sensors, laid straight across the paddock or along the proposed building footprint. We trigger the sledgehammer or weight drop at multiple shot points, and the seismic waves travel through the gravels, silts, and underlying soft rock that characterise the Heretaunga Plains. What comes back is a velocity model built from first-arrival picks, processed with iterative ray-tracing algorithms. It is not just a pretty colour section; it tells you where the compacted gravel stops, where the weathered limestone begins, and whether there is a low-velocity zone that might complicate a foundation design under NZS 3404. In a city that sits on 40-metre-deep alluvial deposits overlying Pliocene limestone, knowing that interface depth within half a metre changes the piling strategy entirely. We run these surveys for warehouse pads, bridge abutments, and residential subdivisions where borehole data alone leaves too many gaps.
A seismic velocity section gives you what a borehole cannot: continuous lateral coverage that reveals hidden paleochannels and pinch-outs across the entire building pad.
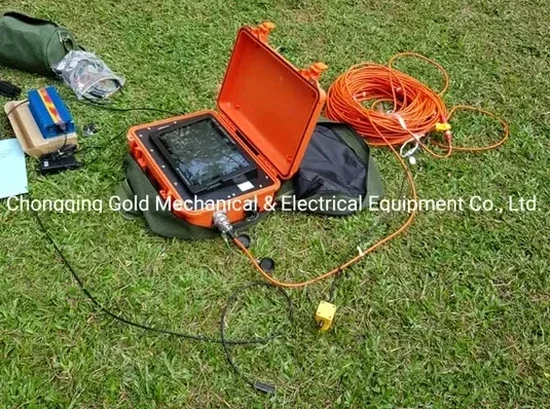
Technical details of the service in Hastings
Risks and considerations in Hastings
Hastings sits at 11 metres above sea level, and much of its industrial land is built on Holocene alluvium that includes loose, saturated sands from old river channels. The 1931 Hawke's Bay earthquake, magnitude 7.8, raised the coastline by several metres and liquefaction features were documented across the plains. When we run a seismic survey on a site near the Ngaruroro River, we are not just mapping depth to limestone; we are looking for saturated loose layers with P-wave velocities under 600 m/s that coincide with the zones where a CPT might show a friction ratio above 2.5 percent. That combination—low velocity plus high friction ratio—is a liquefaction red flag under NZGS guidelines. Skipping the geophysical step means you might place a heavy foundation on a lens of saturated fine sand that will lose all bearing capacity during a design-level earthquake. The tomography gives you the spatial extent of that lens so the structural engineer can decide whether to remove it, densify it, or design around it with deep piles founded in the competent limestone.
Our services
Every seismic tomography campaign we run in Hastings is tailored to the question the structural engineer or developer needs answered. Below are the services that typically wrap around the geophysical survey, turning raw velocity data into a buildable ground model.
2D Refraction Tomography for Foundation Design
We deploy 24–48 channel spreads across building pads and road alignments, delivering P-wave velocity sections that map rippability, bedrock depth, and low-velocity anomalies. Used extensively for warehouse and cold-storage projects in the Irongate and Omahu Road industrial areas.
MASW and Shear Wave Velocity Profiling
Multi-channel analysis of surface waves combined with active-source refraction to derive Vs profiles for NZS 4203 site class determination. Critical for any structure requiring seismic design category assessment on the Heretaunga Plains.
Combined Seismic-CPT Site Characterisation
We calibrate seismic velocity models with cone penetration test data at key tie points, giving you both stiffness and drainage parameters in one integrated report. This approach is standard for liquefaction screening under NZGS Module 2.
Borehole-to-Surface Tomography for Deep Infrastructure
For bridge piers and deep excavations, we run cross-hole or downhole seismic surveys that measure velocity directly between boreholes, resolving thin layers that surface refraction might miss below 25 metres depth.
Questions and answers
What is the typical cost of a seismic refraction survey in Hastings?
For a standard 69-metre line with 24 geophones and multiple shot points, the cost ranges between NZ$4,650 and NZ$8,590, depending on access conditions, number of shots required, and whether MASW processing for shear wave velocity is included. Larger sites requiring multiple parallel lines or combined CPT calibration will be quoted after a site walk.
How deep can seismic refraction see in the Heretaunga Plains geology?
With an accelerated weight drop or a heavy sledgehammer source, we routinely image to 25–30 metres in the alluvial gravels and silts of Hastings. The depth limit is controlled by the seismic velocity contrast and the length of the geophone spread. Where the limestone bedrock is deeper than 30 metres, we combine the refraction line with a CPT or borehole to constrain the deeper model.
Can seismic tomography replace boreholes for foundation design?
Not entirely. Seismic tomography gives continuous lateral coverage and velocity-based stiffness, but it does not provide soil samples for classification, Atterberg limits, or direct strength testing. The best approach in Hastings is a hybrid investigation: one or two boreholes or CPT soundings for material calibration, tied to seismic lines that map the spatial variation between them. More info.